SoDiagram2D
- InventorModule
genre Diagram authors Tobias Block, Olaf Konrad package MeVisLab/Standard dll SoDiagram2D definition SoDiagram2D.def see also StylePalette, ConcatenateCurves keywords Draw, curve, display, line, area, error, bar, extensions
Purpose
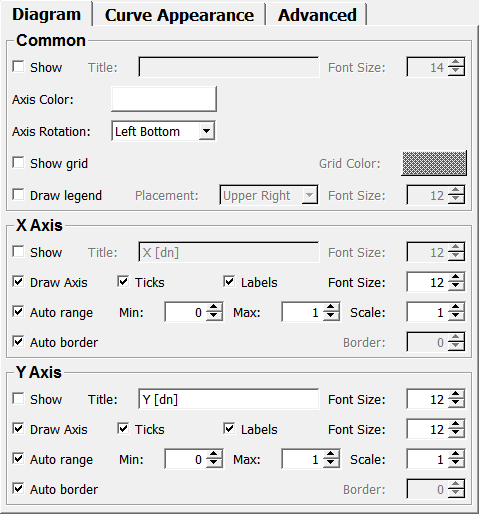
The module SoDiagram2D draws curves as a diagram.
Also, this appearance of the diagram, like the style and the labeling of the axes can be adjusted by this module.
The module can furthermore render a legend and can restrict the zooming of a diagram.
Usage
Just attach this module to a SoRenderArea or any other viewer.
There is a number of extension modules for the SoDiagram2D module to add interaction (zooming, measuring, etc.) or different types of background.
Add the extensions in front of this module.
Input Fields
Parameter Fields
Field Index
Visible Fields
Min (minX)
- name: minX, type: Float, default: 0
Sets the minimum range in x-direction.
Is set automatically if Auto range is checked.
Max (maxX)
- name: maxX, type: Float, default: 1
Sets the maximum range in x-direction.
Is set automatically if Auto range is checked.
Min (minY)
- name: minY, type: Float, default: 0
Sets the minimum range in y-direction.
Is set automatically if Auto range is checked.
Max (maxY)
- name: maxY, type: Float, default: 1
Sets the maximum range in y-direction.
Is set automatically if Auto range is checked.
Auto range (autoRangeX)
- name: autoRangeX, type: Bool, default: TRUE
If checked, the range for the x-axis is computed and set automatically.
Auto range (autoRangeY)
- name: autoRangeY, type: Bool, default: TRUE
If checked, the range for the y-axis is computed and set automatically.
Axis Rotation
- name: axisRotation, type: Enum, default: AXIS_ROTATION_LEFT_BOTTOM
Defines how the axes are rotated.
Values:
| Title | Name |
|---|---|
| Left Bottom | AXIS_ROTATION_LEFT_BOTTOM |
| Right Bottom | AXIS_ROTATION_RIGHT_BOTTOM |
| Left Top | AXIS_ROTATION_LEFT_TOP |
| Right Top | AXIS_ROTATION_RIGHT_TOP |
| Bottom Left | AXIS_ROTATION_BOTTOM_LEFT |
| Bottom Right | AXIS_ROTATION_BOTTOM_RIGHT |
| Top Left | AXIS_ROTATION_TOP_LEFT |
| Top Right | AXIS_ROTATION_TOP_RIGHT |
Font Size (titleFontHeight)
- name: titleFontHeight, type: Integer, default: 14
Sets the font height of the title string.
Show (drawDiagramTitle)
- name: drawDiagramTitle, type: Bool, default: FALSE
If checked, a title string is rendered above the diagram.
Title (diagramTitleString)
Show grid
- name: drawGrid, type: Bool, default: FALSE
If checked, a grid is rendered in the background of the diagram.
Grid Color
- name: gridColor, type: Color, default: 0.349999994039536 0.349999994039536 0.349999994039536
Sets the color of the grid that can be rendered in the background of the diagram.
Placement
- name: legendPlacement, type: Enum, default: LEGEND_UPPER_RIGHT
Defines the placement of the optional legend.
Values:
| Title | Name |
|---|---|
| Upper Right | LEGEND_UPPER_RIGHT |
| Lower Right | LEGEND_LOWER_RIGHT |
| Lower Left | LEGEND_LOWER_LEFT |
| Upper Left | LEGEND_UPPER_LEFT |
Font Size (legendFontHeight)
- name: legendFontHeight, type: Integer, default: 12
Sets the font size of the optional legend.
Use Zoom Restrictions
- name: useZoomRestrictions, type: Bool, default: FALSE
If checked, the module restricts interactive zooming.
The diagram can be zoomed by using the extensions SoDiagram2DAxisZoom and/or SoDiagram2DZoom.
Draw Children Extensions
- name: drawChildrenExtensions, type: Bool, default: TRUE
If checked, extension modules are regarded while rendering the diagram.
Forward Events To Children Extensions
- name: forwardEventsToChildrenExtensions, type: Bool, default: TRUE
If checked, events are forwarded to extensions in the scene.
Change opacity (changeLineOpacityForHighlightedCurves)
- name: changeLineOpacityForHighlightedCurves, type: Bool, default: FALSE
If checked, the opacity of highlighted curves is changed.
Curve Line Opacity Highlighted
- name: curveLineOpacityHighlighted, type: Float, default: 1
Sets the opacity of highlighted curves.
Change opacity (changeLineOpacityForNotHighlightedCurves)
- name: changeLineOpacityForNotHighlightedCurves, type: Bool, default: FALSE
If checked, the opacity of non-highlighted curves is changed.
Curve Line Opacity Not Highlighted
- name: curveLineOpacityNotHighlighted, type: Float, default: 0.30000001
Sets the opacity of non-highlighted curves.
Change style index (changeLineStyleForHighlightedCurves)
- name: changeLineStyleForHighlightedCurves, type: Bool, default: FALSE
If checked, the line style is changed of highlighted curves.
Curve Line Style Highlighted
- name: curveLineStyleHighlighted, type: Integer, default: 1
Sets the line style of highlighted curves.
Change style index (changeLineStyleForNotHighlightedCurves)
- name: changeLineStyleForNotHighlightedCurves, type: Bool, default: FALSE
If checked, the line style of non-highlighted curves is changed.
Curve Line Style Not Highlighted
- name: curveLineStyleNotHighlighted, type: Integer, default: 1
Sets the line style of non-highlighted curves.
Curves To Be Highlighted
- name: curveIndexHighlighted, type: String
Sets the ids of the curves to be set as highlighted.
Auto border (autoBorderH)
- name: autoBorderH, type: Bool, default: TRUE
If checked, the horizontal border size is computed and set automatically.
Auto border (autoBorderV)
- name: autoBorderV, type: Bool, default: TRUE
If checked, the vertical border size is computed and set automatically.
Draw Axis (drawAxisX)
- name: drawAxisX, type: Bool, default: TRUE
If checked, the x-axis is rendered.
Draw Axis (drawAxisY)
- name: drawAxisY, type: Bool, default: TRUE
If checked, the y-axis is rendered.
Ticks (drawTicksX)
- name: drawTicksX, type: Bool, default: TRUE
If checked, ticks are rendered along the x-axis.
Ticks (drawTicksY)
- name: drawTicksY, type: Bool, default: TRUE
If checked, ticks are rendered along the y-axis.
Labels (drawLabelsX)
- name: drawLabelsX, type: Bool, default: TRUE
If checked, labels are rendered along the x-axis.
Labels (drawLabelsY)
- name: drawLabelsY, type: Bool, default: TRUE
If checked, labels are rendered along the y-axis.
Show (drawAxisTitleX)
- name: drawAxisTitleX, type: Bool, default: FALSE
If checked, a title string is rendered for the x-axis.
Show (drawAxisTitleY)
- name: drawAxisTitleY, type: Bool, default: FALSE
If checked, a title string is rendered for the y-axis.
Title (axisTitleStringX)
- name: axisTitleStringX, type: String, default: X [dn]
Sets a title string for the x-axis.
Title (axisTitleStringY)
- name: axisTitleStringY, type: String, default: Y [dn]
Sets a title string for the y-axis.
Font Size (axisTitleFontHeightX)
- name: axisTitleFontHeightX, type: Integer, default: 12
Sets the font size of the title for the x-axis.
Font Size (axisTitleFontHeightY)
- name: axisTitleFontHeightY, type: Integer, default: 12
Sets the font size of the title for the y-axis.
Font Size (axisLabelFontHeightX)
- name: axisLabelFontHeightX, type: Integer, default: 12
Sets the font size for the labels for the x-axis.
Font Size (axisLabelFontHeightY)
- name: axisLabelFontHeightY, type: Integer, default: 12
Sets the font size for the labels for the y-axis.
Curve Color
- name: curveColor, type: Color, default: 1 1 1
Sets the color of the rendered curves.
The colors set in the optionally attached StylePalette overwrite this color.
Line Style
- name: lineStyle, type: Enum, default: LINE_STYLE_SOLID
Sets the line style for the rendered curves.
The line styles set in the optionally attached StylePalette overwrite this line style.
Values:
| Title | Name |
|---|---|
| None | LINE_STYLE_NONE |
| Solid | LINE_STYLE_SOLID |
| Dashed | LINE_STYLE_DASHED |
| Dotted | LINE_STYLE_DOTTED |
Marker Type
- name: markerType, type: Enum, default: MARKER_TYPE_NONE
Sets the marker type for the rendered curves.
The marker types set in the optionally attached StylePalette overwrite this marker type.
Values:
| Title | Name |
|---|---|
| None | MARKER_TYPE_NONE |
| Dot | MARKER_TYPE_DOT |
| Asterisk | MARKER_TYPE_ASTERISK |
| Circle | MARKER_TYPE_CIRCLE |
| Square | MARKER_TYPE_SQUARE |
| Triangle | MARKER_TYPE_TRIANGLE |
| Plus | MARKER_TYPE_PLUS |
| Cross | MARKER_TYPE_CROSS |
Marker Size
- name: markerSize, type: Integer, default: 10
Sets the marker size of the rendered curves.
The marker sizes set in the optionally attached StylePalette overwrite this marker size.
Line Width
- name: lineWidth, type: Integer, default: 1
Sets the line width of the rendered curves.
The line widths set in the optionally attached StylePalette overwrite this line width.
Anti Alias
- name: antiAlias, type: Bool, default: TRUE
If checked, the curves are rendered using anti-aliasing.
The anti-alias settings set in the optionally attached StylePalette overwrite this anti-alias setting.