| 3.3. Using the ImageLoad Module | ||
|---|---|---|
 | Chapter 3. Loading and Viewing Images |  |
| 3.3. Using the ImageLoad Module | ||
|---|---|---|
| | Chapter 3. Loading and Viewing Images | |
![[Note]](images/note.png) | Note |
|---|---|
For the following section, we expect that the Views Output Inspector and Module Inspector are open. If necessary, add them via View → Views. |
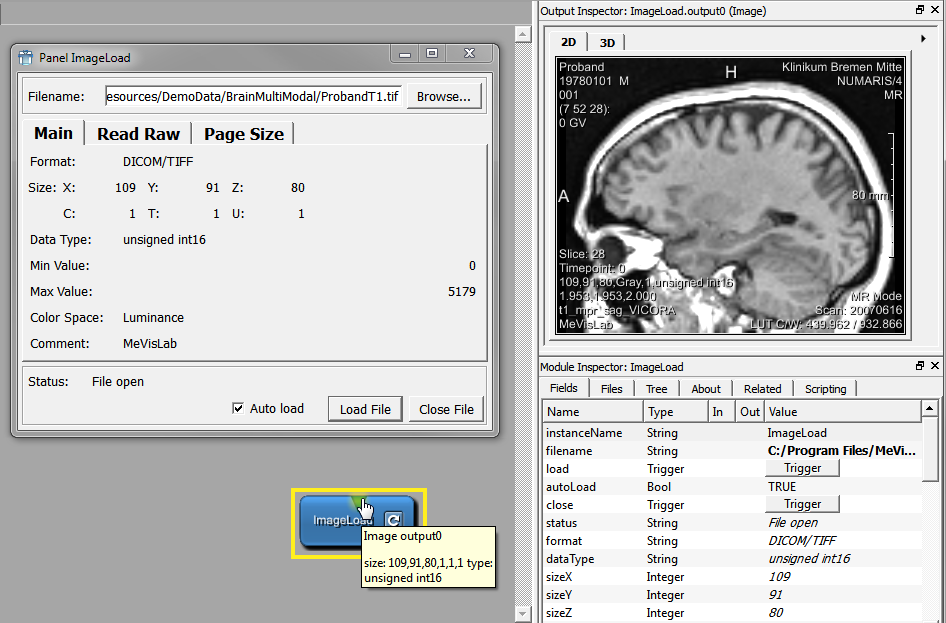
First, we need to load an image.
Double-click the ImageLoad
module to open its panel.
Click Browse to select a file for display. The default file browser opens.
Go to the MeVisLab DemoData directory at
$(InstallDir)Packages/MeVisLab/Resources/DemoData
in the MeVisLab installation path and select a file, for example a
MRI scan of a head (Head4_t1.small.tif). The image is
loaded immediately. (Instead of ImageLoad, you could also use LocalImage which is optimized for loading
images in relative paths, as explained in Section 3.5.2, “Using the LocalImage Module”).
![[Tip]](images/tip.png) | Tip |
|---|---|
If you would like to start with your own image data immediately, please see the chapter Section 3.6, “A Note on Importing DICOM Images” on how to convert your DICOM slices into the internal file format of MeVisLab first. Then continue in place. |
Module panels are intended to stay open, so keep the panel open or minimize it if it gets in your way. There are two ways to minimize a panel:
Click the minimize button on the top right of the panel window: this will minimize only this panel.
Select Panels → Minimize All Open Panels (or press the respective keyboard shortcuts): this will minimize all panels of this network.
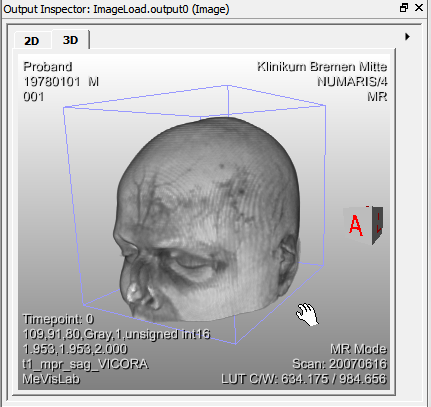
For display, you can either add a viewer (we will do this later in this example) or you can click the module's output connector to display the image in the Output Inspector.
The great thing about the Output Inspector is that it will display the output of any connector (or data connection) in the process chain (as long it is a format the inspector can interpret). So if you are ever unsure about what is actually the input or output of a module, simply click the connector or connection to find out.
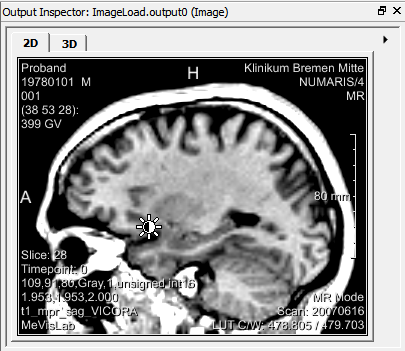
Your image does not look like this? One reason might be that the slice of the image you are looking at has no information. Click on the Output Inspector and scroll through the slices by
using the mouse wheel
keeping the middle mouse button (mouse wheel) pressed and moving the mouse up and down
pressing the arrow keys Up or Down (Left or Right slice through time points)
Still not seeing anything? Then try to adjust the visibility range by changing the windowing. For this, keep the right mouse button pressed while moving the mouse up/down (for window width) or left/right (for window center). During these actions, the mouse cursor changes into a contrast symbol.
Both on the panel and on the additional information of the
Output Inspector, the image properties can
be found. In the Output Inspector, you can
open them by clicking  .
.
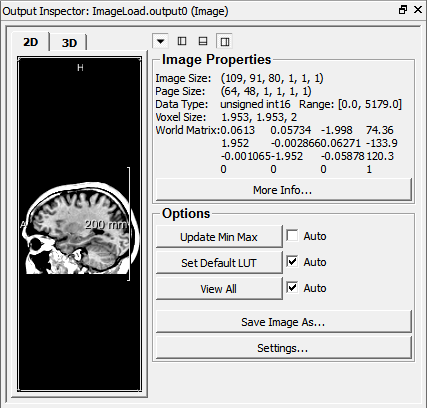
The image properties show the following information (see Chapter 12, Excursion: Image Processing in ML for more information):
Image Size in x, y, z, c, t, u
Page size in x, y, z, c, t, u
Data type and range
Voxel size in mm
World matrix
A number of options are available:
More Info...: opens the panel of an Info module showing additional information about the image.
Update Min Max: scans in the input image for the real min/max values. Also resets the LUT on base of the new min/max values.
Set Default LUT: sets the LUT on base of the image's min/max values or on stored DICOM tags if available.
View All: centers the rendered image in the 3D view, has no effect in the 2D view.
Save Image As...: Saves the image to disk.
Settings...: Shows the panel of the used 2D viewer. Has no effect on the 3D rendering.
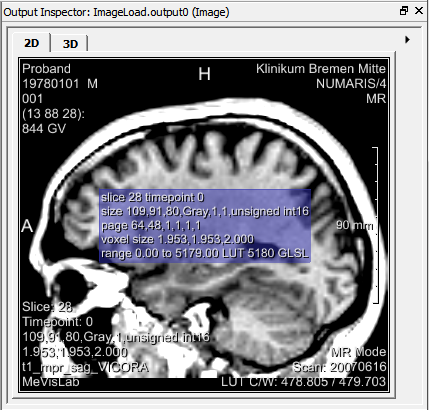
The layout of the Output Inspector's viewer and control panel can be adjusted.
In addition, two key shortcuts are available:
A: Toggles the display of the annotations.
I: Toggles the display of an additional information display.
A 3D display is possible (in case of a single slice its depth is the voxel depth). For this, click the 3D tab in the Output Inspector.
| Note |
|---|---|
The 2D and 3D views are independent of each other. |
The 3D display can be rotated. The orientation can be seen on the little cube in the lower right corner of the viewer (Notation: A = anterior, front; P = posterior, back; R = right side; L = left side; H = head; F = feet). You can also use the windowing described above for the 2D view.
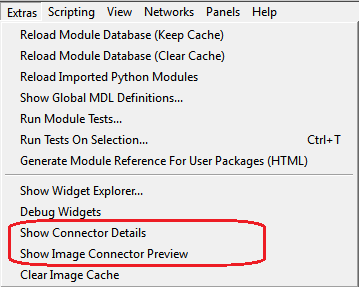
The information given in the panel and the 2D view image properties of the Output Inspector can also be displayed right next to the module connector. For this, check
Extras → Show Image Connector Preview for a thumbnail preview and/or
Extras → Show Connector Details for connector details.
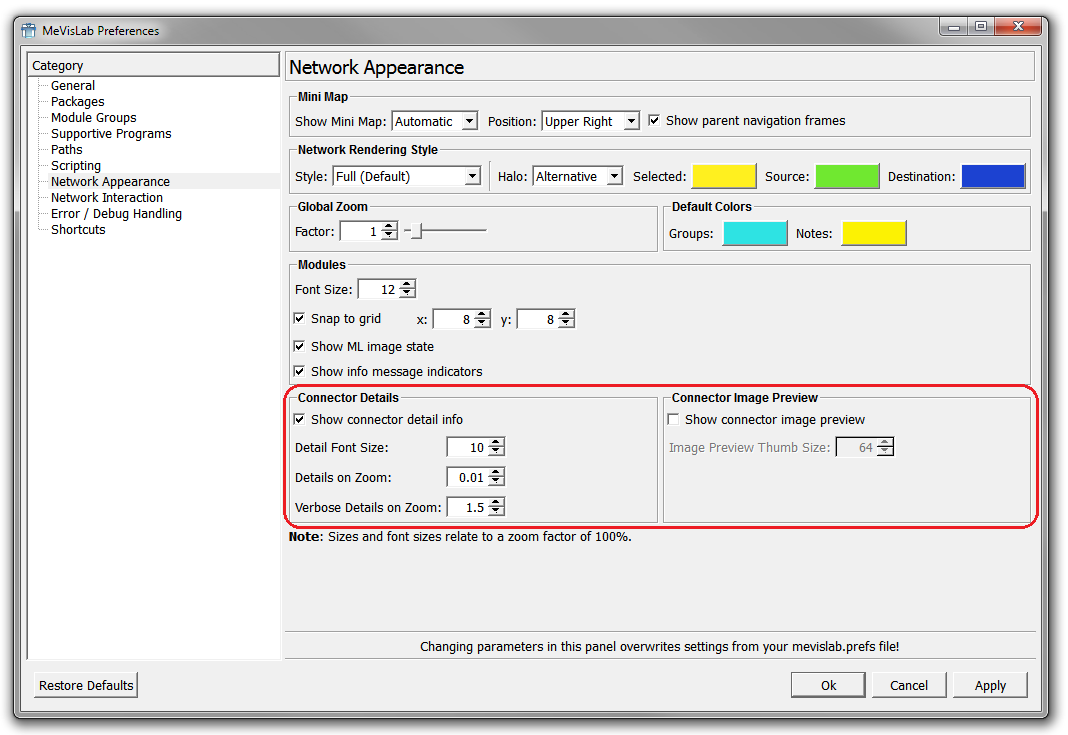
Alternatively, activate the respective options in the Preferences, section “Network Appearance” (on Windows and Linux: Edit → Preferences; on Mac OS X: MeVisLab → Preferences).
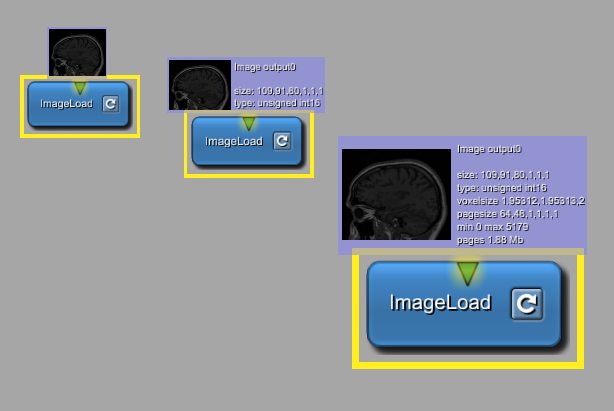
The additional information is displayed when single-selecting a module. The amount of displayed information depends on the zoom factor. To zoom in/out of a network, scroll with the mouse wheel.
For this example, we will work without the connector details display, because it tends to clutter the interface.
© 2023 MeVis Medical Solutions AG
| |  | |
| 3.2. Searching and Adding Modules |  | 3.4. Adding Viewers to ImageLoad |