| 4.3. Preferences | ||
|---|---|---|
 | Chapter 4. Menu Bar |  |
| 4.3. Preferences | ||
|---|---|---|
| | Chapter 4. Menu Bar | |
![[Note]](images/note.png) | Note |
|---|---|
Settings in the Preferences
panel overwrite the corresponding settings in the |
The Preferences (and other information, like the list of recent files or the stored user layouts) are saved in a way that they are not overwritten when updating/reinstalling MeVisLab:
On Windows: in the
Registry in Workstation/HKEY_CURRENT_USER/Software/Mevis/MeVisLab.
On Mac OS X: in $HOME/Library/Preferences/de.mevis.MeVislab.plist.
On Linux: in $HOME/.config/MeVis/MeVisLab.conf.
![[Tip]](images/tip.png) | Tip |
|---|---|
For many options in the Preferences, a mouse-over tip is available. |
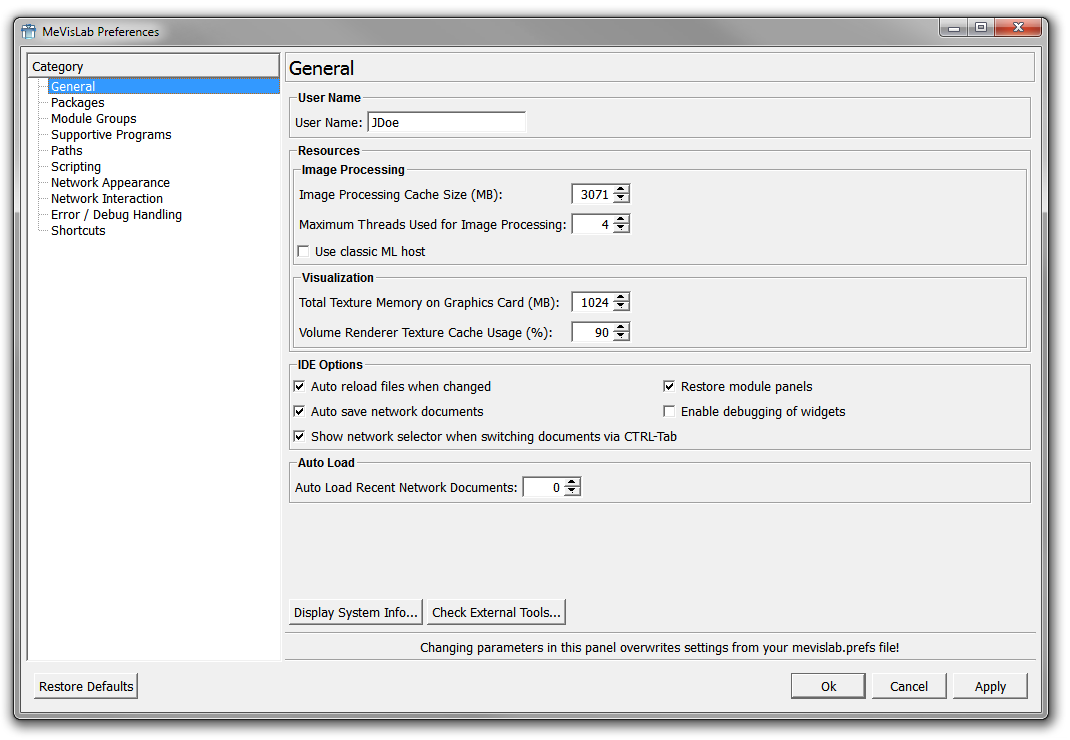
User Name
The user currently signed in at this computer.
Resources
The optimal Resources settings depend on the system and platform. Use the default settings if in doubt.
Image Processing
Image Processing Cache Size (MB)
Defines the memory available for caching (intermediate) ML image tiles/pages within a network of image processing modules. Reducing the cache size will slow down the image processing pipelines because images will be recalculated more frequently in individual modules. Cache sizes too large might cause a collapse of your system because of reduced memory for other programs. For 2 GB RAM, a value of 512 MB is well-tested. For details, see the ML Programming Guide, “Optimizing Data Flow in Module Networks”.
Maximum Threads Used for Image Processing
Gives the number of parallel threads for image processing. For more details on multi-threading, see Section 27.7, “Multi-threading in MeVisLab”.
Use classic ML host
If checked, the classic ML host (the only available option before MeVisLab 2.5) is used. Otherwise, a new ML host is used that implements an optimized multi-threading for the ML.
Visualization
Total Texture Memory on Graphics Card (MB)
Gives the amount of texture memory (texture RAM, TRAM) on the graphics card to be used for MeVisLab texture processing, for example in the View2D module.
Volume Renderer Texture Cache Usage (%)
Defines the percentage of texture memory that the GVR volume renderer may use.
IDE Options
Auto reload files when changed
If selected, the .def, .script, and .py files of a module are
reloaded when reloading the module panel (by double-clicking the module or
selecting Show Window → Panel from the module context menu).
| Note |
|---|---|
Networks |
Auto save MeVisLab documents
If selected, MeVisLab networks are auto-saved as <NetworkName>.mlab.auto upon major changes. This allows for restoring in case of system crashes. Auto-saved copies are deleted when the according networks are saved.
Show network selector when switching documents via CTRL-Tab
If selected, pressing CTRL+TAB (or SHIFT+CTRL+TAB) does not switch directly to the next or previous network document, but shows a network selector preview. For more details, see Section 3.15, “Network Selector”.
Restore module panels
If selected, opening a network restores all module panels (including window size and position) to the state (open, minimized, positions, etc.) when the network was last saved.
Enable debugging of widgets
Enables/disables debugging module panels. When enabled, CTRL+left-clicking a GUI control in a module panel opens the .script file in the default text editor at the line in which the GUI control is defined.
Auto Load Recent Files
Gives the number of recent networks to be loaded automatically on MeVisLab startup. This may considerably slow down the startup.
| Note |
|---|---|
If loading a network leads to a crash, this option can be harmful, because on the next start of MeVisLab, that network will automatically be loaded, which in turn will lead to a crash! Use this option with care! |
Display System Info...
Displays system information regarding the Open GL vendor, the available GL extensions, and more in an extra window.
Check External Tools...
Starts the Tools Check tool that checks for software necessary for certain build tasks. This tool is also part of the ToolRunner. See the ToolRunner Documentation for details.
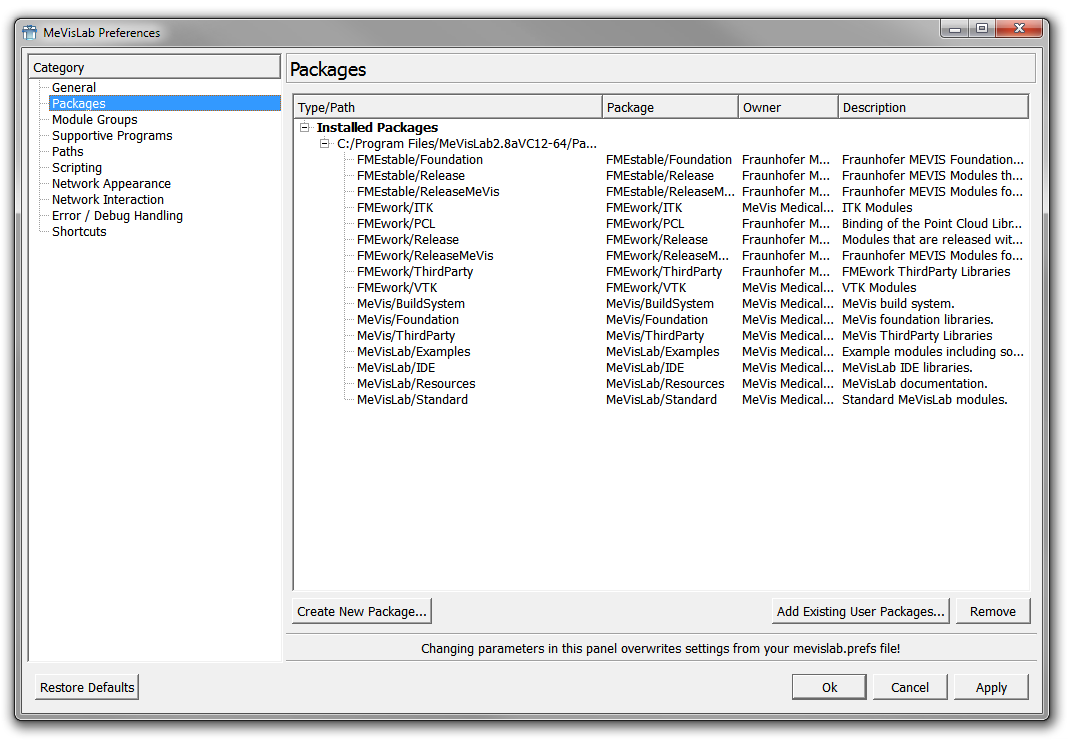
MeVisLab modules are organized in packages. These are defined as certain folder structures (see the Package Structure documentation for details). The Packages category gives an overview over the available and active packages.
The packages are separated into:
User Packages: packages found in the user path (packages in other paths can be added manually). These are the default packages for user-defined modules.
mevislab.prefs: packages resulting from the paths given in the prefs file.
Installed Packages: packages resulting from an installation of, e.g., the MeVisLab SDK.
If a package with the same PackageIdentifier is found more than once, the last package found will overwrite the previously loaded packages (in the order given above, see the Package Structure documentation for details). These will be grayed out and labeled “(Overwritten)”.
Create New Package
Opens the Package Wizard, see Section 25.5, “Packages”.
Add Existing User Packages
Opens the default file browser to add a user package. Folders are read recursively and all packages below them are automatically included.
Remove
Removes the selected user package from the path of MeVisLab. (Installed packages cannot be removed.) Removed user packages can always be re-added later.
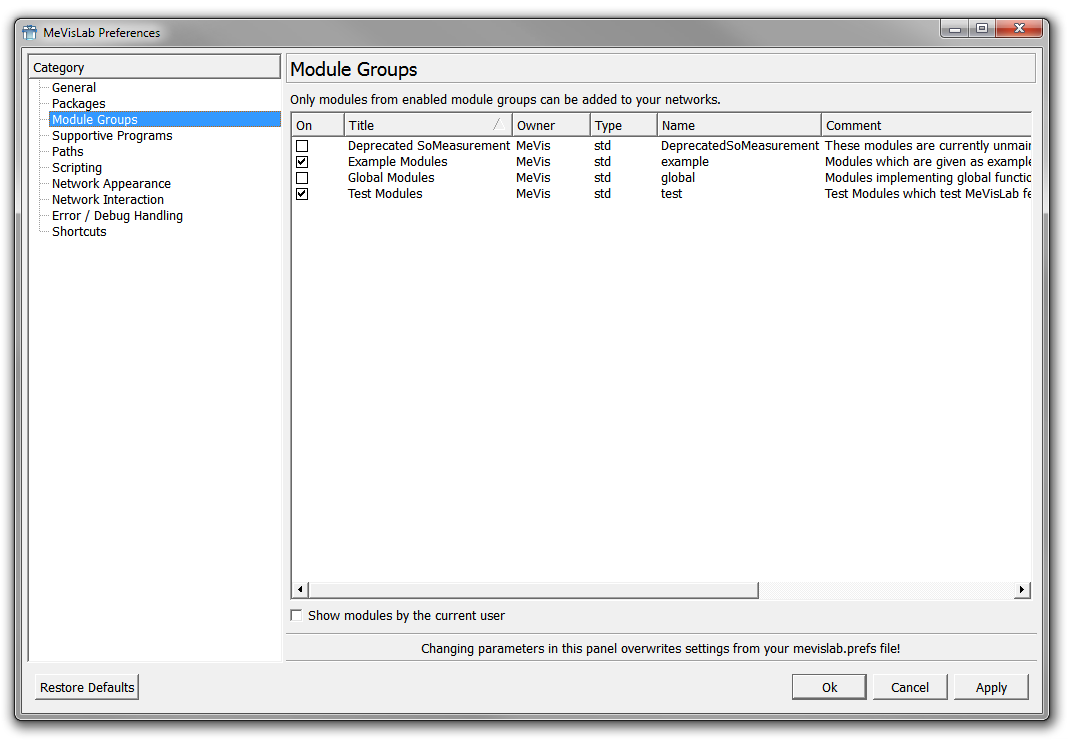
The Module Groups category lists optional groups of modules that are not loaded by default. Check the corresponding group to get access to modules of the group.
Scroll to the right to see additional comments and the number of modules for each group.
After confirming the selection with OK, the package groups of the selected modules and the user packages are scanned and loaded.
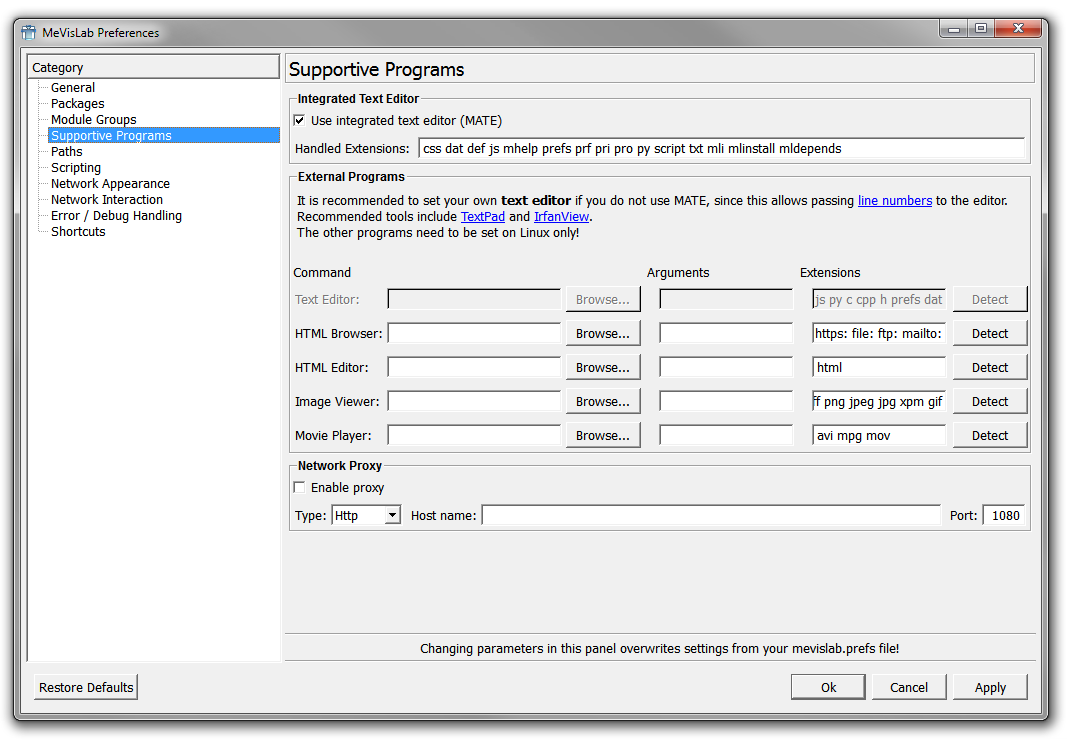
Internal Text Editor
Use internal text editor (MATE)
If selected, the internal text editor MATE is used, which offers many useful features for MeVisLab files. Recommended! See Chapter 26, MATE for details.
Handled Extensions
Allows to define a list of file extensions for which MATE is automatically opened.
External Programs
Allows to define extern applications plus program arguments for file types used in MeVisLab. Click Browse to select the applications manually, or Detect to autodetect applications that work especially well with MeVisLab.
| Note |
|---|---|
On Linux it can happen that an external program depends on a third party library that MeVisLab provides. If problems occur, e.g., because a KDE program loads an incompatible Qt library from MeVisLab, then use a shell script that clears LD_LIBRARY_PATH before it calls the external program. For example, to safely run konqueror from MeVisLab, place the following script in ~/bin and make sure ~/bin is the first entry in PATH before running MeVisLab. #!/bin/sh
LD_LIBRARY_PATH= konqueror
|
Arguments are options added when starting the program. They can be entered manually or are added by the Detect feature.
Extensions lists the extensions for which the assigned program will be used. This overrides your system settings, but only in the MeVisLab context.
TextEditor: Although it is recommended to use the internal text editor MATE, other text editors can be used in conjunction with MeVisLab. With the argument %f(%l), a file and a line number in it will be passed to the text editor. The Detect feature will check for TextPad on Windows (see the web link for installing) and set the options accordingly.
ImageViewer: Graphic applications may be used in conjunction with MeVisLab. If none is set, the system default will be used. The Detect feature will check for IrfanView on Windows (see the web link for installing) and set the options accordingly.
MoviePlayer, HTMLBrowser, HTMLEditor: may primarily needed to be set on Linux.
Network Proxy
Allows to set a proxy server for HTTP connections of the WebKit implementation of Qt.
Enable proxy: If selected, a proxy is used by the WebKit implementation.
Type: Sets the type of the used protocol.
Host name: Sets the host name of the proxy server.
Port: Sets the port of the proxy server.
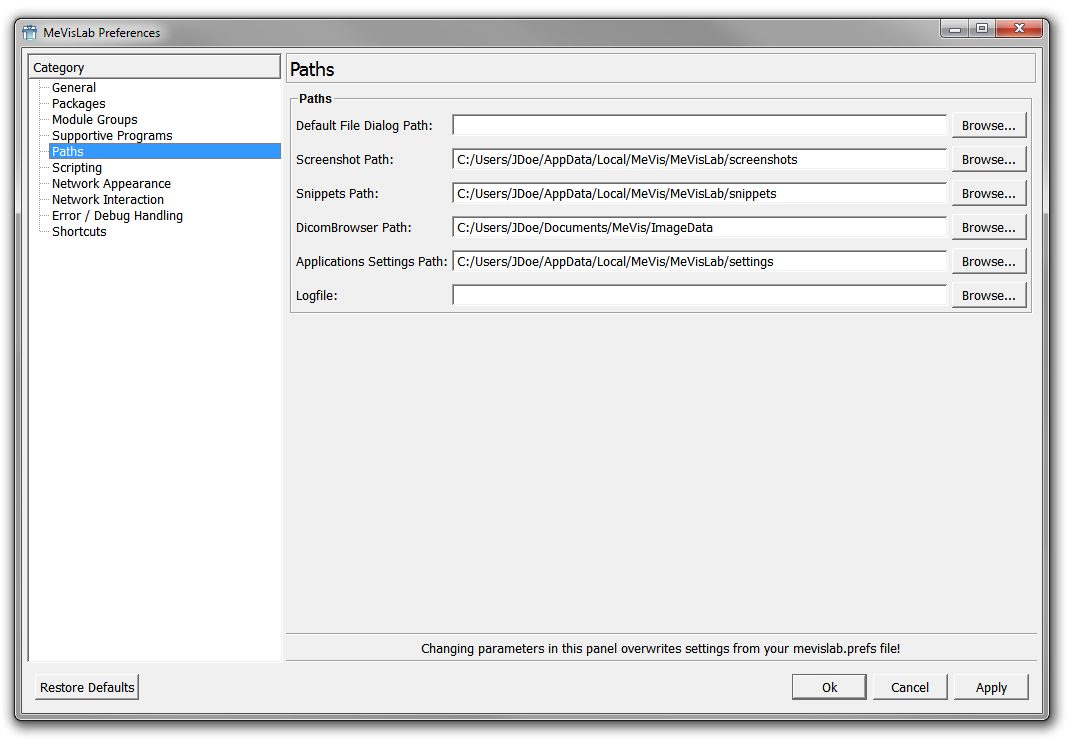
Default File Dialog Path
Sets the default path in the file dialog. If none is entered, the path last used will be offered.
Screenshot Path
Sets the path for files of the View Screenshot Gallery, see Chapter 19, Screenshot Gallery.
Snippets Path
Sets the path for network snippets, see Chapter 24, Snippets List
DicomBrowser Path
Sets the path where the DICOMBrowser module and the OpenImage module look for DICOM data by default.
Applications Settings Path
Sets the path in which MeVisLab applications save their settings.
Logfile
Sets the path to the logfile written by MeVisLab.
| Note |
|---|---|
You can also set the path to the logfile in the .prefs file with |
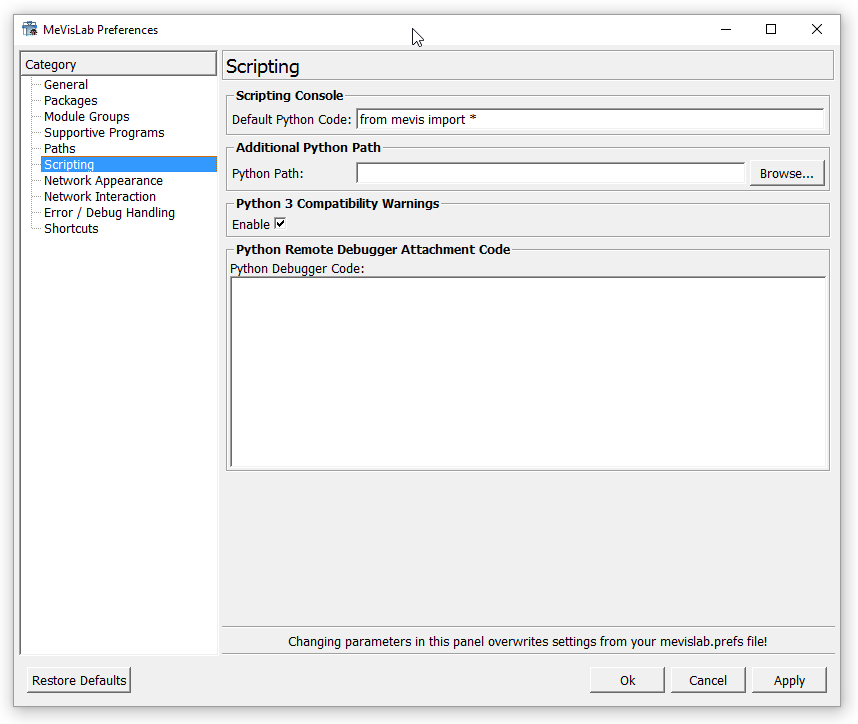
Scripting
Default Python Code
Sets a default Python code snippet that is used in the scripting console as default.
Additional Python Path
Add the path to an additional Python package so it can be found in the import statement.
Python Debugger Code
Sets Python debugger code as described in the Scripting Reference.
| Note |
|---|---|
The 'Additional Python Path' and the 'Python Debugger Code' are for attaching an external debugger to Python. Using an external Python debugger is obsolete since MATE has a built-in debugger for Python (see Section 26.8, “Python Debugger”). |
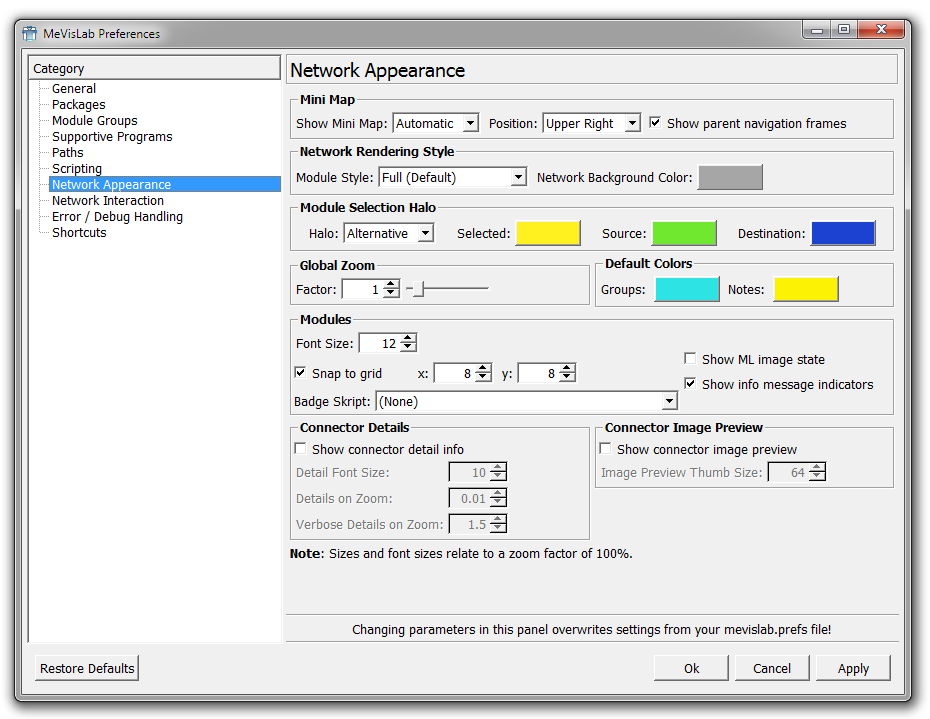
Mini Map
Show Mini Map
The Mini Map is an overview map. See also Section 3.13, “Using the Mini Map”.
The following settings for the Mini Map are available:
Show Mini Map
Automatic: Is displayed when parts of the network are outside the workspace.
Never: Is never displayed.
Always: Is always displayed.
Position
Defines the position of the Mini Map: Upper Right (default), Lower Right, Upper Left, Lower Left.
Show parent navigation frames
(For macro modules only) Shows the hierarchy of the opened networks. For example, when adding a View2D module, opening its internal network and there the internal network of View2DExtensions, the hierarchy of involved macro modules will be displayed in small frames next to the usual mini map (which might not be shown, depending on its mode).
Network Rendering Style
Style
Offers four options for styling the network rendering:
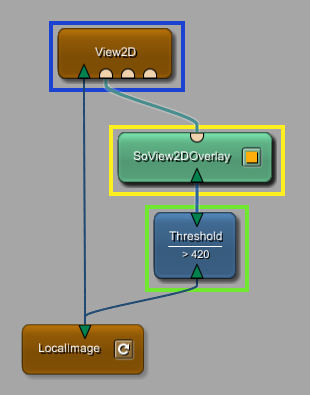
Full (Default): Network is rendered in color with 3D and highlighting effects.
Print (Black & White): Network is rendered as simple black-and-white drawing.
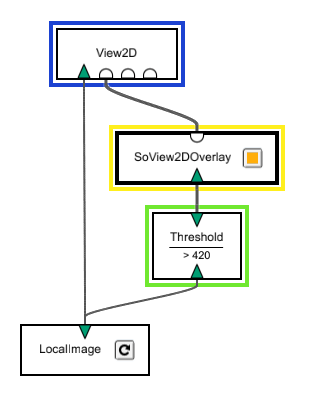
Print (Color): Network is rendered as a simple color drawing without effects and a white background.
Comic: Network is rendered as a simple color drawing without effects but with a gray background.
All four styles are fully functional in terms of editing, connecting modules, displaying a Mini Map, etc. However, it is recommended to use the print styles only when screencapturing and printing the network.
Halo
Offers two options for styling the halo of highlighted modules:
Classic (Default): The halo is rendered as classic halo effect.
Alternative: The halo is rendered as rectangle around the module.
To change the halo colors of the selected modules and the modules attached to them, edit the settings of Selected, Source, and Destination by clicking on the respective color field.
Global Zoom
Factor
Sets a global zoom factor. Only applicable to modules and networks that do not fill the network space automatically. Other modules/networks will be displayed with the given global zoom factor upon double-clicking the networks space or using the button  (Show the whole network) in the toolbar.
Default Colors
Groups
Sets the background color for module groups, see Section 3.11, “Using Groups”. The default is green.
Notes
Sets the background color for notes, see Section 3.12, “Using Notes”. The default is yellow.
Modules
Font Size
Sets the font size of the module name in the display (number referring to a zoom of 100%).
Snap to grid
Sets the grid size in the workspace to which the modules snap when moved.
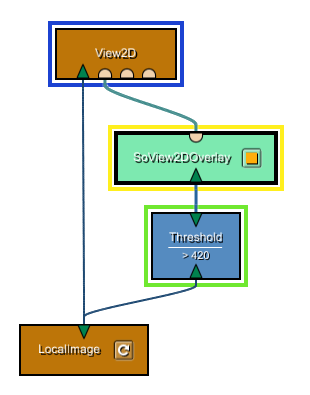
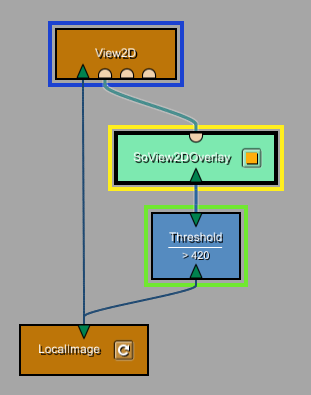
Show ML image state
Shows the image states by coloring the connectors.
Green: Valid and updated ML image.
Yellow: Valid but not updated ML image.
Red: Invalid ML image.
Badge Script
Select a script that provides a badge icon for modules. Badge icons are intended to make users aware of certain properties of a module. See Section 4.3.7.1, “How to define your own badge scripts” for how to define your own badge scripts.
Connector Details
Show connector detail info
Enables detailed information for ML image, Inventor, or Base objects currently available on the connectors when a single module is selected.
Detail Font Size
Sets the font size for the connector detail info.
Details On Zoom
Sets the threshold zoom factor below which the details are not displayed.
Verbose Details On Zoom
Sets the threshold zoom factor below which the verbose details are not displayed.
Connector Image Preview
Show Connector Image Preview
Shows an image preview for an image connector when a single module is selected.
Image Preview Thumbnail Size
Sets the size of the image preview thumbnails in pixel.
| Note |
|---|---|
All sizes and fonts relate to a zoom factor of 100%. |
A badge script consists of a single .py Python file and a .def file
(which just points to the Python file and declares a title for display in a combo box).
The script is treated like an invisible macro module. For each module type the run() function
of the script is called with the module's type as string argument. The run function may return a dictionary with
the entries "icon", which should be the path of an icon (preferably .png), "description", which is a text that
is displayed in the tooltip of the module, and possibly "icon_size", if the icon must be scaled down for network
display - this should be something like "20x20". When no icon should be displayed for a module,
None can be returned.
Example MyBadgeScript.def file:
BadgeScript {
  title = "Some example badge script"
  source = "$(LOCAL)/MyBadgeScript.py"
}
Example MyBadgeScript.py file:
from mevis import *

def run(moduleName):
    author = MLAB.moduleInfo(moduleName).get("author")
    if author and "John" in author:
        return {
            "icon": "$(LOCAL)/johns.png",
            "description": "Module written by a John"
        }

    return None
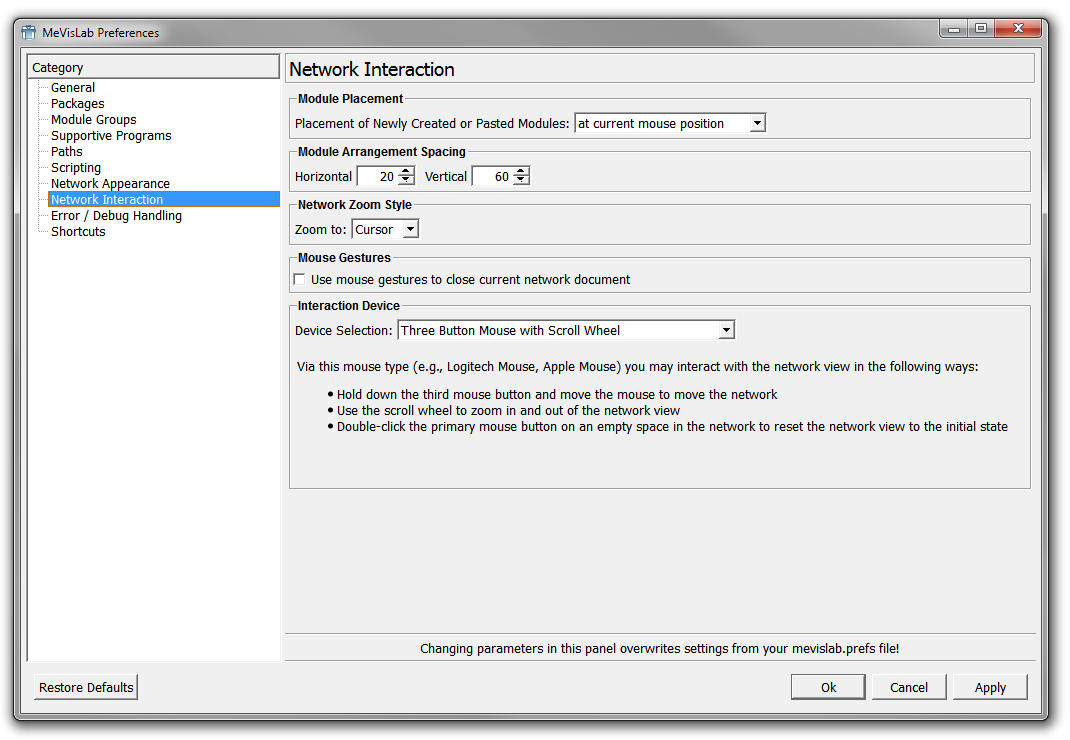
Module Placement
Placement of newly created or pasted modules
Defines where newly created or pasted modules are placed in the network:
into the middle of a network: Modules are inserted in the middle of the network space; multiple modules are inserted with a slight offset in position.
at current mouse position (Default): Modules are inserted at mouse position; multiple modules are inserted in a cascading manner. If the mouse cursor is outside of the network window, the modules are placed into the middle of the network.
Module Arrangement Spacing
Horizontal / Vertical
Enter arbitrary values to adjust the distances between modules for the autoArrange scripting command. (The settings do not directly translate to pixels but depend on the zoom and other factors.)
Network Zoom Style
Zoom to
Defines to which position the zoom should be centered around. Available options are to zoom to the center of the network or to zoom to the current cursor location.
Network Mouse Gestures
Use mouse gestures to close current network document
Enables or disables the use of mouse gestures (see Section 3.17, “Network Mouse Gestures”).
This option only has an effect on Windows systems because on Linux and Mac OS X, the context menus are opened on right-click and not on right-button release.
Interaction Device
Device Selection
Allows selecting special interaction devices (mice, touch pads, especially Apple devices). For each selected option, the available features are listed beneath.
Three button mouse with scroll wheel (Default)
Two button mouse with scrolling in multiple directions, for example Apple Magic Mouse
Multi-touch pad, for example Apple MacBook Touchpad
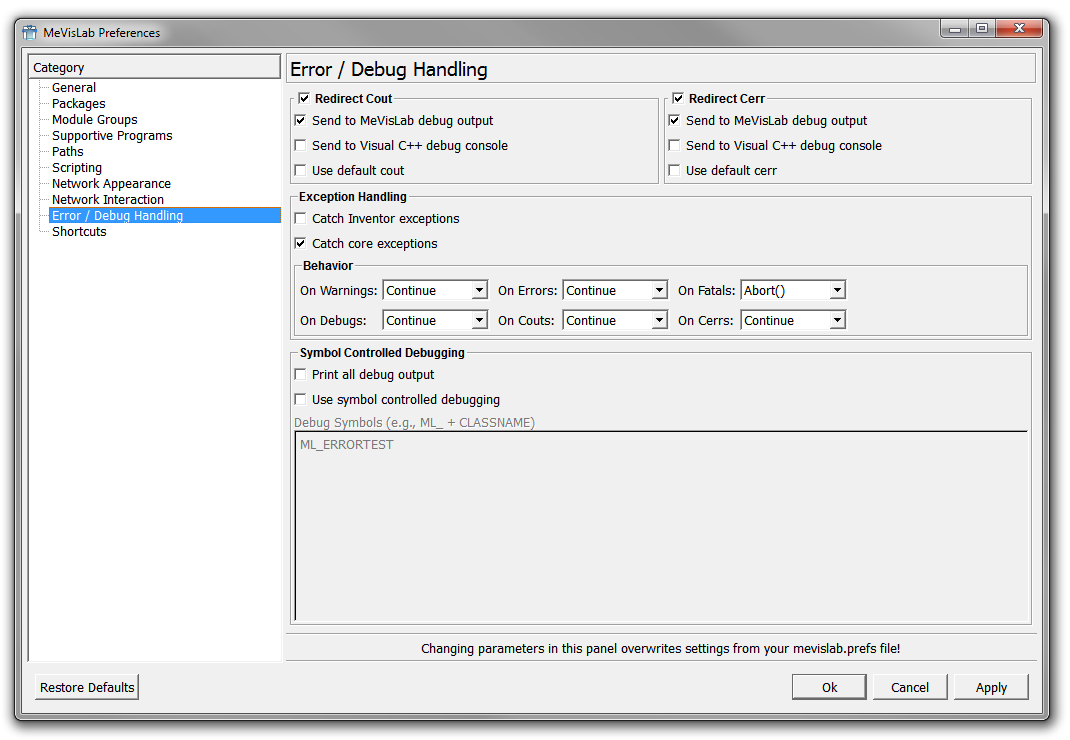
cout (standard output stream) and cerr (standard output stream for errors) are standard outputs in C++. The difference is that std::cout is a buffered stream especially useful for general output, while std::cerr is not buffered and therefore especially useful for error messages. The outputs are independent of each other, so both can be directed to other targets.
Redirect cout
Enables the redirect of the cout stream.
Send to MeVisLab debug output
Redirects cout to the Debug Output (default).
Send to Visual C++ debug console (Windows only)
(Only if MeVisLab is started from within Visual C++) Redirects cout to the Visual C++ Debug Console (on Windows).
Use default cout
Redirects cout to the default output (for example a console). Needs to be activated explicitly, otherwise only the redirect will be output.
Redirect cerr
Enables redirect of the cerr stream.
Send to MeVisLab debug output
Redirects cerr to the Debug Output. (default).
Send to Visual C++ debug console (Windows only)
(Only if MeVisLab is started from within Visual C++) Redirects cerr to the Visual C++ debug console.
Use default cerr
Redirects cerr to the default output (for example a console). Needs to be activated explicitly, otherwise only the redirect will be output.
Exception Handling
Catch inventor exceptions and Catches core exceptions
Exceptions are handled as selected for each kind of exception:
On Warnings, On Errors, etc.
Defines what is to happen upon warnings, errors, etc. Especially helpful if no source code for real tracing is available. Possible settings: Continue, Abort, Exit(0), Exit(ErrCode).
Symbol Controlled Debugging
Print all debug output
Prints out all debug outputs from the code (for example everything tagged with ML_DEBUG).
Use symbol controlled debugging
The debugging is done based on symbols, that is special classes. Enter the debug symbols to filter for in the text field, for example ML_ERRORTEST.
| Note |
|---|---|
Refer to the ML Guide for detailed information on symbol-controlled debugging. |
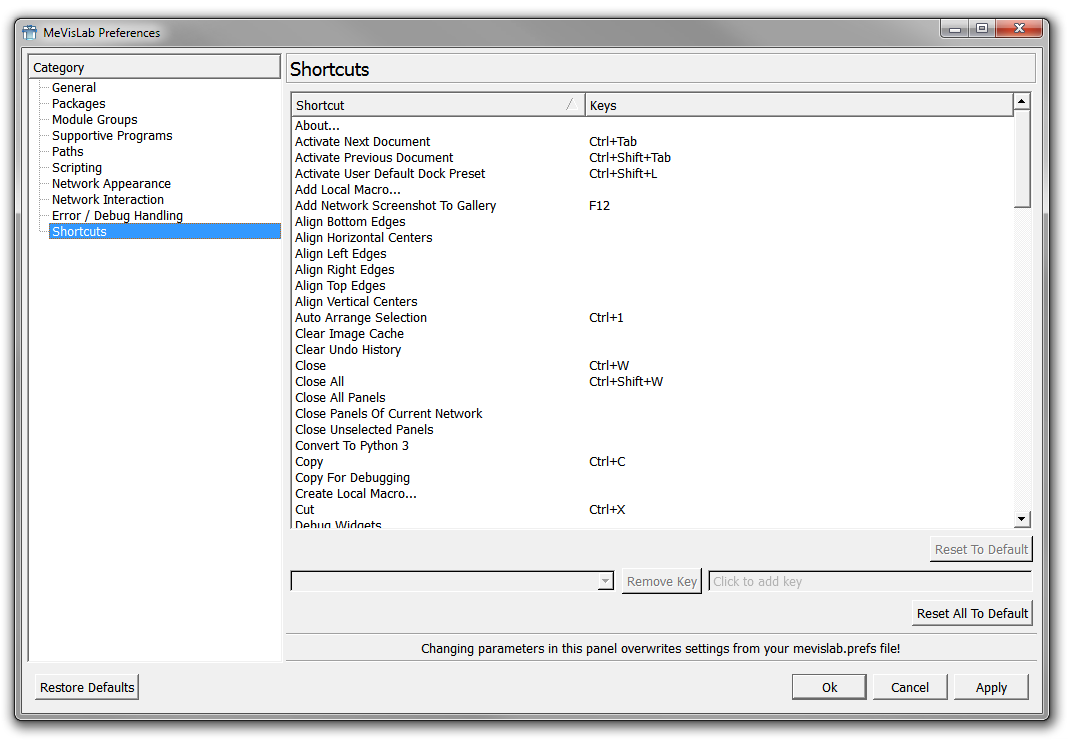
The shortcut editor allows to set and/or change shortcuts for various actions. It also shows which shortcuts are active at the moment.
To remove a shortcut for an action, select the action, select its shortcut key (if there are multiple), and press Remove Key.
To set a keyboard shortcut, select the action and click into the field that says Click to add key. Then, press the key or key combination you want to use for this action. This can be done multiple times, adding a shortcut for the action at each repetition.
| Note |
|---|---|
The same shortcut editor is available in MATE. |
Reset To Default
Resets the keyboard shortcut for the selected action to its default.
Remove Key
Removes the currently shown shortcut key for the selected action.
Reset All To Default
Resets all keyboard shortcuts to their defaults.
© 2023 MeVis Medical Solutions AG
| |  | |
| 4.2. Edit Menu |  | 4.4. Modules Menu |