| Chapter 16. Parameter Connections Inspector | ||
|---|---|---|
 |  | |
| Chapter 16. Parameter Connections Inspector | ||
|---|---|---|
| | | |
Table of Contents
The Parameter Connections Inspector works only on parameter connections, not on data connections.
As explained in Section 3.3, “Connector and Connection Types”, data connections may be of the types Base (square/brown), Inventor (half circle/green) and ML image (triangle/blue). Only connectors of fitting types may be connected, by clicking the connector and drawing a line to the other connector.
In case of parameter connections, field values are connected. This can be used basically for any type of fields. Modules with no input/output connectors can only be connected by parameter connections, for example calculation modules like ComposeRotation. For more examples on using parameter connections, see the Getting Started, chapter “Parameter Connection for Synchronization”.
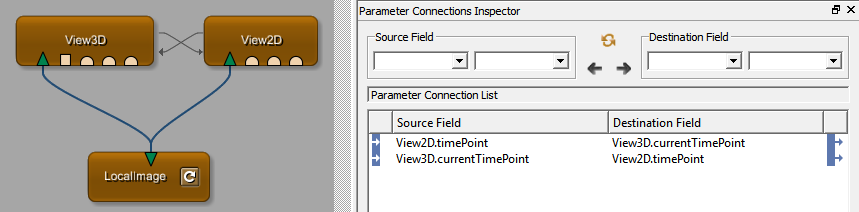
Parameter connections need a source and a destination field. If the source field changes, for example a value increases from 1 to 20, the destination field value increases the same. Source and destination fields can be connected bidirectionally; in that case, increasing the value in the destination field would also increase the value in the source field (see Figure 16.2, “Parameter Connection Example — View2D and View3D”). A destination field can also be the source for another connection, effectively forwarding the parameter value. There is no limit to the number of parameter connections, it is only given by the available fields per module.
A parameter connection can be created in three ways:
by using the drop-down lists on top of the Parameter Connections Inspector. Select the modules and fields to connect and click the respective arrow for creating the connection. By clicking the circle button, source and destination can be swapped.
by dragging fields (parameter labels) from one automatic panel to the other. This works also for buttons.
by dragging fields from one panel or settings window to the other. This does usually not work for buttons.
![[Tip]](images/tip.png) | Tip |
|---|---|
If the button trigger field is created with “field”, the label can be connected by dragging. |
A minimalist bidirectional parameter connection might connect a View2D and a View3D module so that the time points would be synchronized:
![[Note]](images/note.png) | Note |
|---|---|
Fields cannot be connected if they are encapsulated in macros or in already defined panels. (Such fields would only be reachable by scripting.) In this case, that means that the cine settings of |
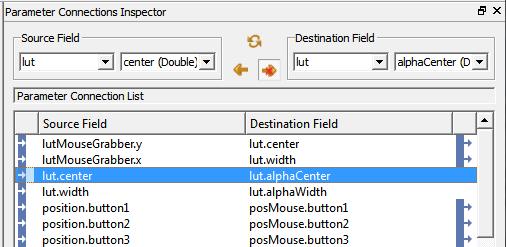
Each source/destination field pair in the list shows an existing connection. If the fields are also the destination or source of another connection, additional arrow symbols are displayed:
Table 16.1. Connections Symbols
| Symbol | Direction |
|---|---|
 | Source field |
 | Destination field |
 | Source and destination field |
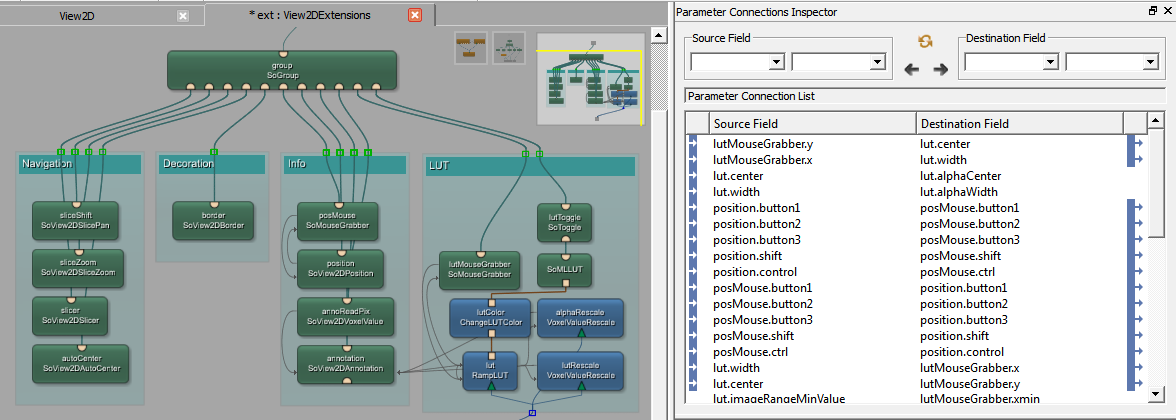
A more realistic example from the internal network of View2DExtensions shows a complex picture with many forwarded parameters.
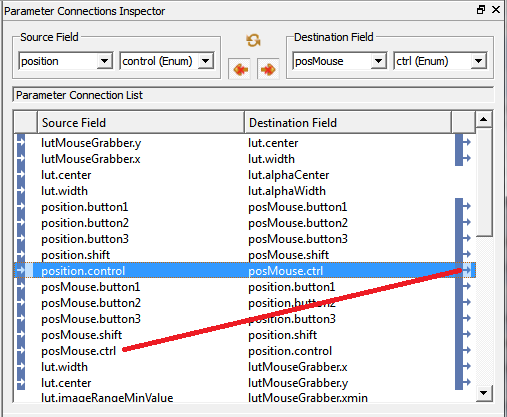
To navigate from destination and source and vice versa, double-click on the respective arrows.
Example: In Figure 16.4, “Parameter Connection Example — Navigating between Fields”,lut.grayWidth is the source of a parameter connection to the destination lut.alphaWidth. lut.alphaWidth itself is the source for another connection. A double-click on the arrow symbol will highlight the list entry where lut.alphaWidth is the source field.
© 2023 MeVis Medical Solutions AG
| | | |
| Chapter 15. Output Inspector |  | 16.2. Parameter Connections Inspector Context Menu |