

The images have been prepared using MeVisLab standard modules as well as advanced modules developed as part of research projects at MeVis. For sources and copyrights information, see the end of the page.

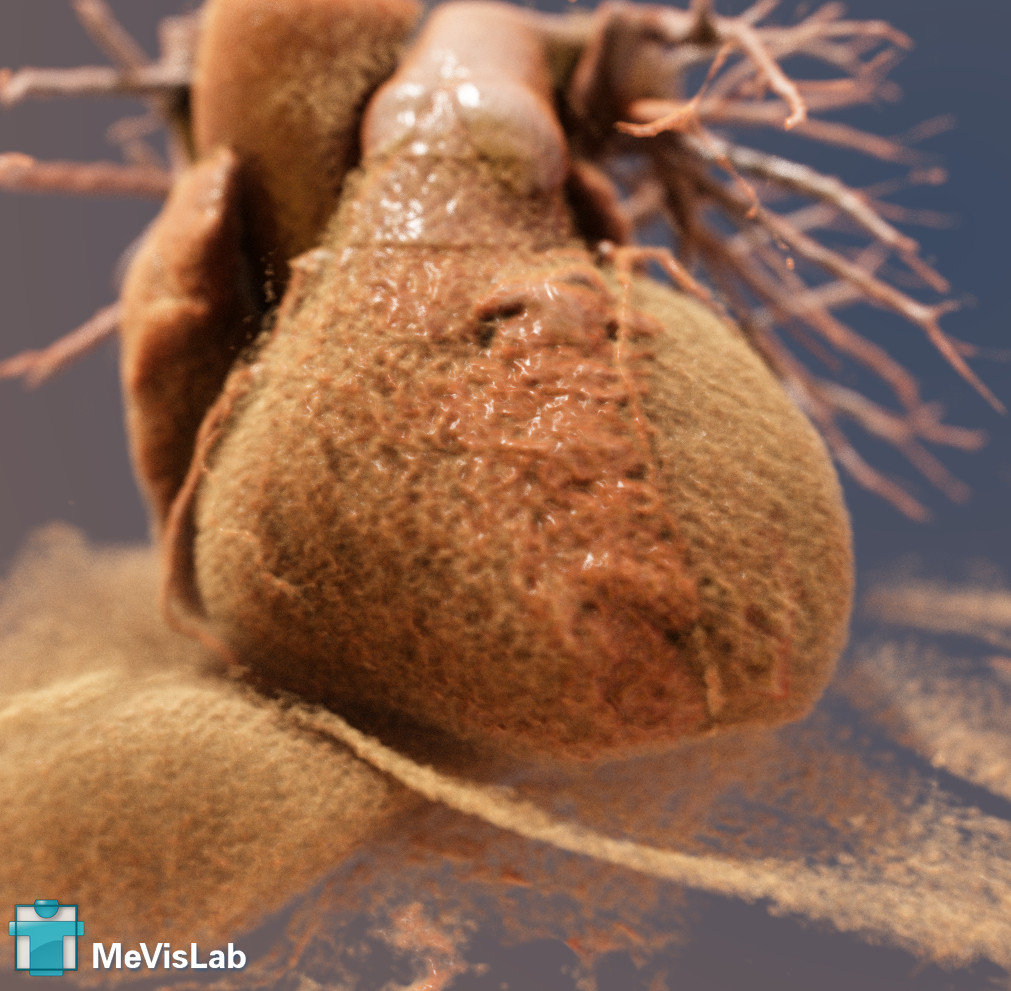
Heart CT rendered using the MeVis Path Tracer framework. For more screenshots of the path tracer, click here.

Simulation of flow in cerebral blood vessels
Reference: Adaptive Surface Visualization of Vessels with Animated Blood Flow, The Authors Computer Graphics Forum, author: K. Lawonn et al.; Otto-von-Gericke- University Magdeburg, Dept. of Simulation and Graphics

Combined visualization of blood vessels and brain fibres
Reference: Fundamentals of Medical Imaging,Cambridge University Press;
author: B. De Dobbelaer; KU Leuven, Dept. of Electrical Engineering

Comprehensive analysis of coronary CTA & perfusion MRI data
Reference: Comprehensive visualization of multimodal cardiac imaging data for assessment of coronary artery disease: first clinical results of the SMARTVis tool, Springer International Publishing AG; author: H. Kirisli; Erasmus MC, Biomedical Imaging Group Rotterdam

Synchronized viewing of cardiac X-ray, CTA, and OCT images
Reference: MEDIATE - Patient friendly medical intervention, author: Mediate project; Erasmus MC, Biomedical Imaging Group Rotterdam

Implementation of a zSpace control within MeVisLab
Reference: zSpace, author: P. Saalfeld; Otto-von-Gericke- University Magdeburg, Dept. of Simulation and Graphics


The MeVisLab IDE offers an intuitive environment to explore and develop complex image processing networks and applications.
Modules, field connections, inspector windows, and many more features support the development workflow.


Numerous visualization modules provide high-quality 2D and 3D rendering.


Head with segmented brain vessels (left). Various visual approaches for neuro-visualization (right).


Different render approaches of the vascular system of thorax and liver.
Application prototypes hide the underlying network complexity and provide an efficient and intuitive user interface.


Brain with segmentation based on fiber tracking (left).
Rendering of arteries (right).


Heart with segmented vessels.


Lung nodule with silhouette enhanced background (left).
Head with highlighted vessels (right).
1: Copyright by MeVis Medical Solutions AG. All rights reserved.
2: Copyright by Fraunhofer MEVIS. All rights reserved.
3: Images by Fraunhofer MEVIS, published under Creative Commons Attributed-Share Alike 3.0 license.